
EXAMPLE WORK · BUSINESS DATA & ANALYTICS
See how business questions become analytical outputs.
Explore example projects covering business questions, analytical methods, validation, findings, and practical decisions.
Explore business analytics work covering ecommerce sales, customer analysis and sales forecasting. The customer-retention presentation is reproduced from a supplied project presentation; its reported results and projections are not independently verified. Explore the analytical approach, findings, checks, limitations and decision use.
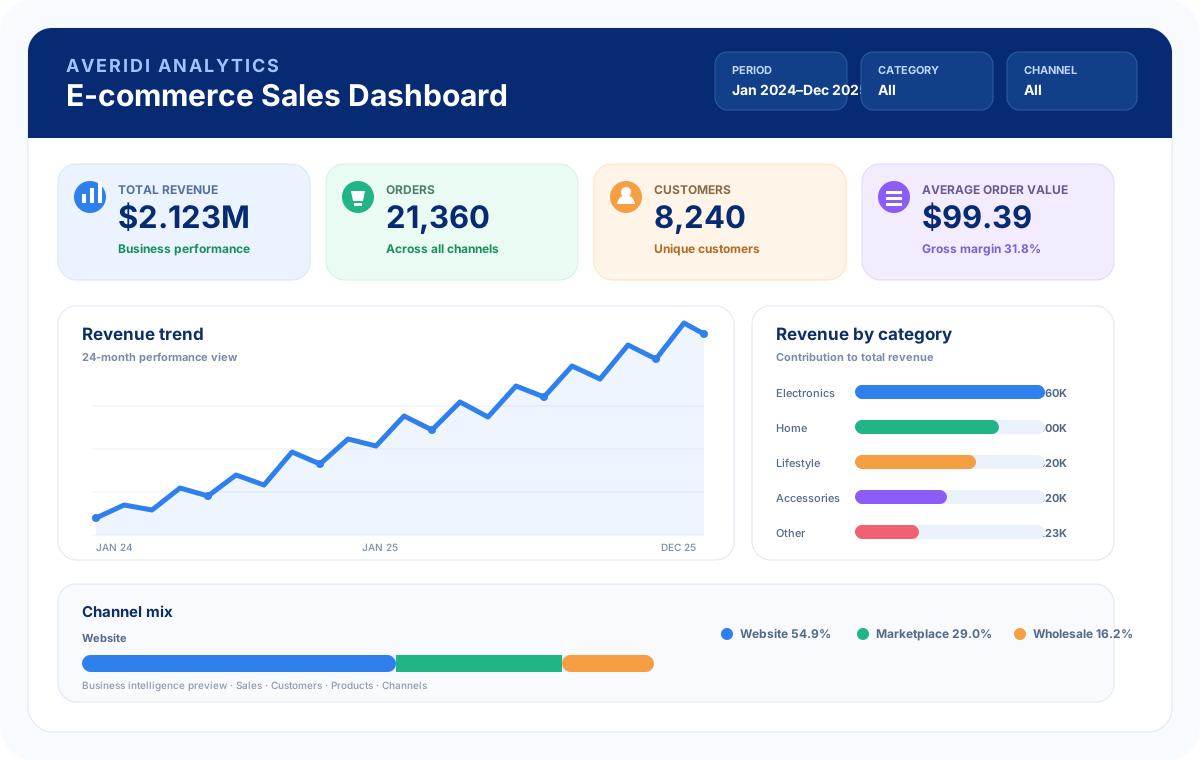
E-commerce Sales Dashboard
A sales-performance dashboard built around a U.S. e-commerce dataset, showing revenue, order volume, product mix, channels and profitability.
Sales KPI dashboard · Monthly revenue trend · Category and channel performance views
Monthly revenue moved from a $68K starting point in January 2024 to $119K in December 2025, with the strongest monthly values concentrated toward the end of the period.
Customer Analysis Example
A customer-behavior analysis using a U.S. transaction dataset to identify differences in value, purchasing frequency and recent activity.
Customer segmentation · Customer value and activity analysis · Segment comparison table
High-value repeat customers represented 660 customers, or 8.0% of the customer base, but generated $740K, approximately 27.0% of total revenue.
Sales Forecast Example
A six-month sales forecast built from 36 months of U.S. sales history, using a seasonal year-over-year method, backtesting, and planning considerations.
Six-month sales forecast · Historical trend visualization · Forecast comparison
Monthly revenue increases from $210K in January 2023 to $382K in December 2025, with positive same-month year-over-year growth throughout the period.
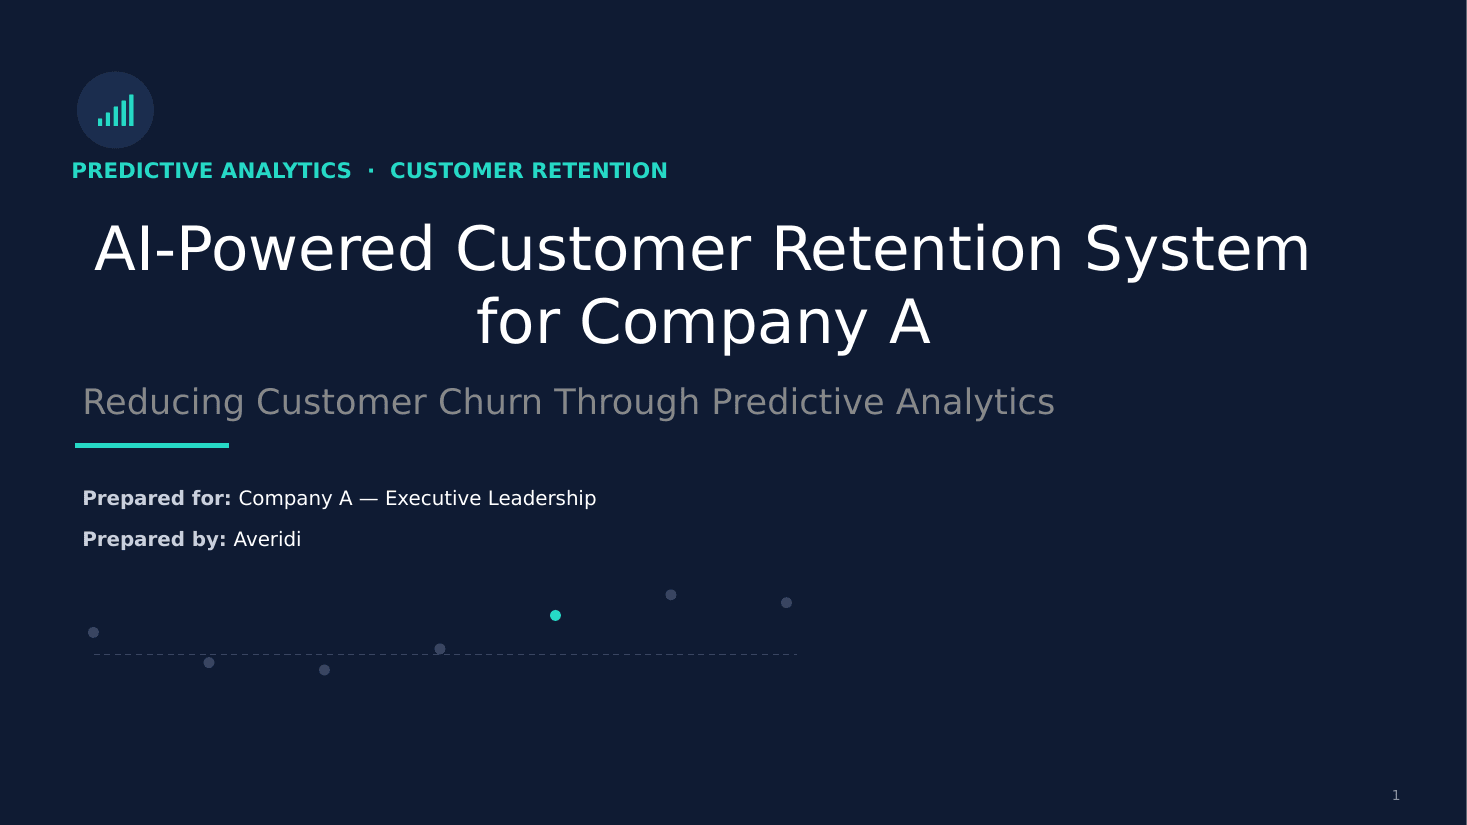
AI-Powered Customer Retention System for Company A
A complete presentation covering churn analysis, XGBoost modeling, evaluation, explainability and a proposed customer-retention workflow.
Predictive modeling · Model evaluation · Explainability
Reported figures and projected business impact are reproduced from the supplied presentation and are not independently verified.
WANT TO APPLY THIS?