
Sales are up.
That should be good news.
But what if you raised prices during the same period? What if customers placed fewer orders? What if you sold fewer units, relied on more discounts, or made less gross profit than you did a year ago?
Suddenly, “sales are up” does not tell you very much.
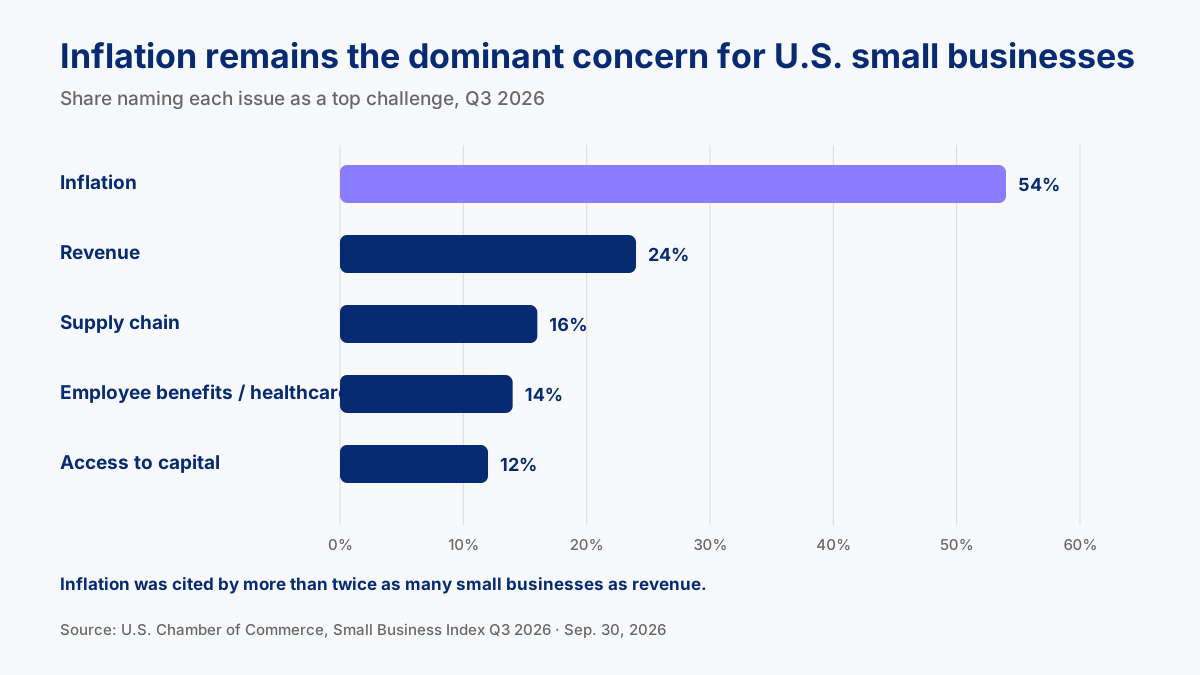
That is a useful question for small businesses right now. In the U.S. Chamber of Commerce's Q3 2026 Small Business Index, 54% of small businesses identified inflation as a top concern, while revenue was a distant second at 24%.
Consumer prices are still moving too. The Bureau of Labor Statistics reported that the Consumer Price Index was 3.7% higher in September 2026 than a year earlier. CPI measures consumer prices, not an individual company's operating costs, so it provides context rather than a business-specific cost diagnosis.
Consumers have not simply stopped spending. Census Bureau estimates show that U.S. retail and food-service sales in August 2026 were 6.0% above August 2025, while also noting that those figures are not adjusted for price changes.
PwC's 2026 Holiday Outlook adds another current signal: eight in ten surveyed consumers said they planned to use a budgeting strategy, while 79% said deals and discounts influence when they shop. The research is holiday-specific, but it reinforces the importance of value in current purchase decisions.
For a small business, the more useful question is: if your revenue is changing, what is actually driving it?
Revenue can rise while demand weakens
Imagine a business whose revenue increased from $200,000 to $214,000. That is 7% growth. At first glance, there is not much reason to worry.
Now add two more numbers:
- orders fell from 2,500 to 2,400;
- units sold fell from 5,000 to 4,550.
The picture changes immediately. The business earned more money, but customers placed fewer orders and bought 9% fewer units. Revenue did not increase because the business sold more. Something else was carrying the result.
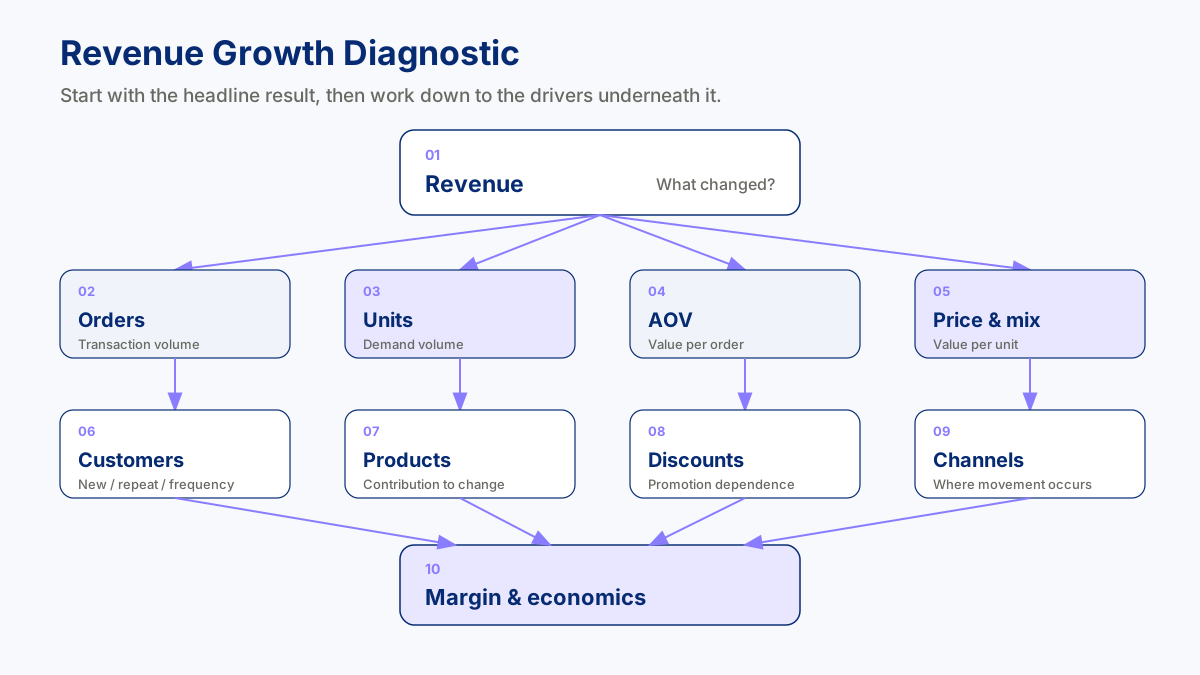
A useful first check is Revenue → Orders → Units → Average Order Value → Revenue per Unit. Each measure answers a different question.
Revenue shows the total value of sales. Orders show transaction activity. Units show actual volume. Average order value shows how much each transaction is worth. Revenue per unit helps reveal whether pricing or product mix is doing more of the work.
For a deeper introduction to this breakdown, see How Small Businesses Can Use Sales Analysis.
A higher order value can hide a shift in what customers buy
Businesses often treat a rising average order value as an obvious positive. Sometimes it is. Customers may be adding more items to their baskets or choosing genuinely higher-value products.
But average order value can also rise because prices increased, or because the product mix changed.
Suppose the average order rises from $80 to about $89 while customers are buying fewer units. The higher order value may be masking weaker volume.
That is why it helps to ask whether customers are buying more items, paying higher prices, moving toward more expensive products, or changing what they buy altogether.
Consider this simple example:
| Product | Previous period | Current period | Change |
|---|---|---|---|
| Product A | $60,000 | $72,000 | +$12,000 |
| Product B | $50,000 | $51,000 | +$1,000 |
| Product C | $30,000 | $39,000 | +$9,000 |
| Product D | $60,000 | $52,000 | −$8,000 |
| Total | $200,000 | $214,000 | +$14,000 |
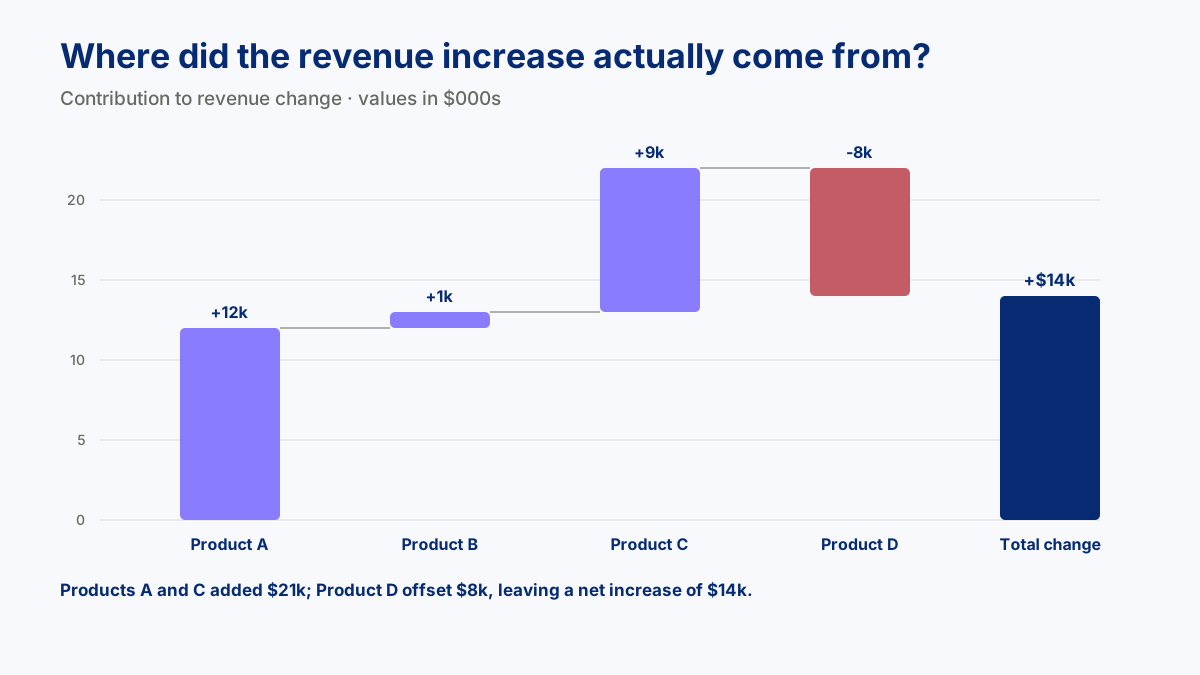
Total sales increased $14,000, but the growth was not broad. Products A and C added $21,000 between them while Product D removed $8,000 of that gain.
Product A contributed the most additional dollars. Product C grew fastest in percentage terms. Product D remained a major product despite declining.
Those are three different findings from the same four products. Simply ranking products by current revenue would miss the pattern.
Watch repeat customers closely
A business can keep revenue looking healthy for some time even while repeat purchasing weakens.
Higher prices may offset fewer purchases. New customers may replace customers who stop returning. One strong product may compensate for declining customer frequency elsewhere.
If reliable customer identifiers are available, compare new and returning customers, repeat-purchase rate, orders per customer, average time between purchases, and revenue from new versus returning customers.
If repeat customers fall 8% while revenue rises, that does not automatically mean the business has a retention crisis. But it is something worth understanding.
Are existing customers purchasing less often? Are new customers replacing them? Are repeat customers becoming more price-sensitive? Are they moving toward different products?
For more on that analysis, see Customer Analysis for Small Businesses: What to Look For.
Discounts can make weak demand look stronger
Imagine that revenue rises while the percentage of discounted orders also rises sharply.
The promotion may have created valuable additional demand. It may also have discounted purchases that would have happened anyway, or pulled future purchases forward.
Instead of judging a promotion only by sales during the promotion, look at what changed around it:
- order volume;
- unit volume;
- average selling price;
- average order value;
- new-customer activity;
- later repeat behavior;
- gross margin where reliable cost data exists.
The goal is not to prove that discounting is bad. It is to know what the discount actually changed.
More revenue does not guarantee more profit
Return to the $200,000-to-$214,000 example.
Suppose gross margin was 38% in the earlier period, producing $76,000 in gross profit. If revenue rises to $214,000 but gross margin falls to 34%, gross profit becomes $72,760.
The business generates $14,000 more revenue while making $3,240 less gross profit.
Here is the full picture:
| Metric | Previous period | Current period | Change |
|---|---|---|---|
| Revenue | $200,000 | $214,000 | +7.0% |
| Orders | 2,500 | 2,400 | −4.0% |
| Units sold | 5,000 | 4,550 | −9.0% |
| Average order value | $80.00 | $89.17 | +11.5% |
| Revenue per unit | $40.00 | $47.03 | +17.6% |
| Repeat customers | 1,200 | 1,104 | −8.0% |
| Discounted-order share | 25% | 30% | +5 pp |
| Gross margin | 38% | 34% | −4 pp |
| Gross profit | $76,000 | $72,760 | −4.3% |
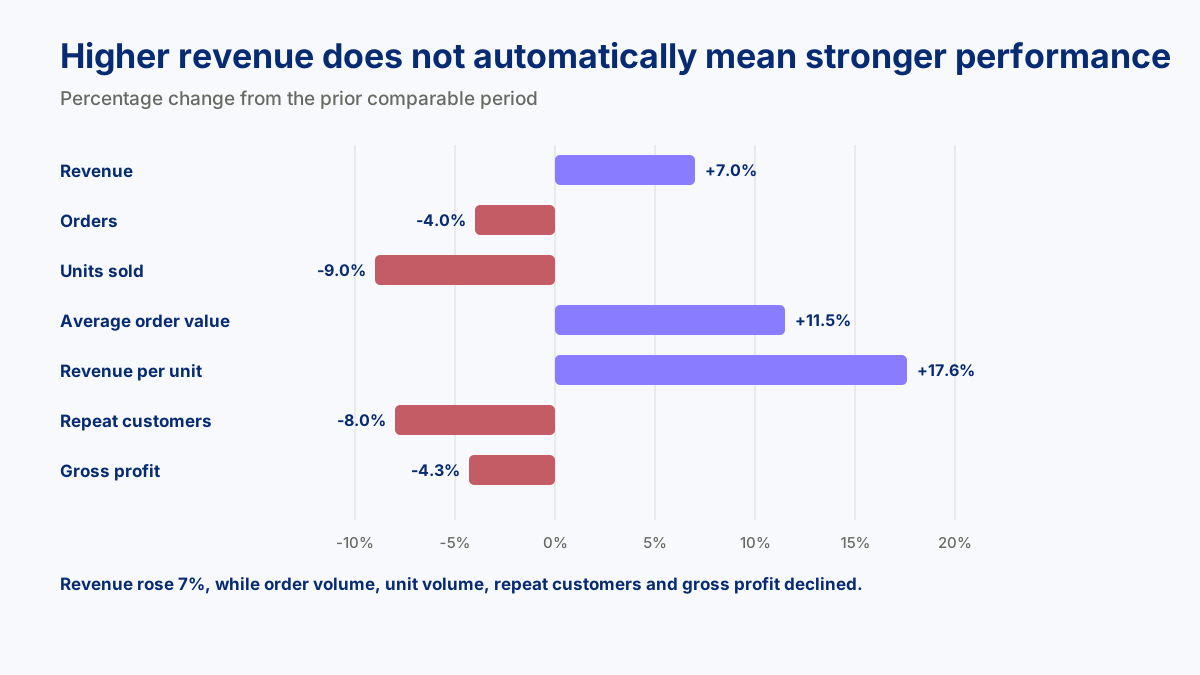
Now the 7% revenue increase means something very different.
The business is generating more money from fewer orders and fewer units. Revenue per unit is higher. Repeat-customer activity is weaker. Discount use is more common. Gross profitability has deteriorated.
That does not automatically mean the business is in trouble. It does mean the headline revenue figure is not enough to judge performance.
Break the numbers down by channel too
The same principle applies when a business sells in more than one place.
Consider a simple channel example:
| Channel | Revenue change | Order change | Question to investigate |
|---|---|---|---|
| Website | +18% | +13% | Which products and customers drove growth? |
| Marketplace | +4% | +7% | Why did revenue grow slower than orders? |
| Physical store | −3% | −5% | Is the issue traffic, conversion, product mix or something else? |
The overall company may still look healthy, but each channel is telling a different story.
Website sales are growing strongly. Marketplace orders are growing faster than marketplace revenue, which may point to a lower average order value. The physical store is declining in both orders and revenue.
Those differences can affect marketing, inventory, staffing and channel investment decisions.
Make sure you are comparing the right periods
Sometimes the problem is not the metric. It is the comparison.
Month-over-month growth can be almost meaningless for a highly seasonal business. A promotion week may look exceptional beside an ordinary week. A partial month can make performance appear much worse than it really is. A stockout can make demand appear lower because the business simply did not have enough product available to sell.
Useful comparisons may include:
- the same month last year;
- the same week last year;
- comparable promotion and non-promotion periods;
- current customer cohorts versus earlier cohorts;
- a product's own historical baseline.
The comparison should match the question. This is also why consistent definitions matter; see Small Business KPIs: Where to Start.
Use outside economic data carefully
Economic data can help explain the environment around a business, but it should not be used as a shortcut for diagnosing the business itself.
For example, the CNBC/NRF Retail Monitor reported September 2026 retail-sales growth while also noting retailers' emphasis on affordability, promotions and value. That is useful context. It still does not tell an individual business why its own customers, products or margins changed.
Use external data to sharpen the questions you ask. Use your own transactions, customers, products, prices and costs to answer them.
When something changes, know what to check next
You do not need dozens of KPIs. You need the next useful question.
| If you notice... | Look at... | Why |
|---|---|---|
| Revenue is up but units are down | Price and product mix | Higher prices or a more expensive mix may be supporting revenue |
| Revenue is up but orders are down | AOV, units per order and price | Fewer transactions are generating more value |
| Orders are stable but basket size is falling | Product mix and units per order | Customers may be buying fewer items |
| Repeat customers are declining | Frequency and new-versus-returning mix | Acquisition may be hiding weaker repeat behavior |
| Discounted orders are increasing | Full-price demand and margin | Performance may be becoming more promotion-dependent |
| Revenue is rising but margin is falling | Costs and realized selling prices | Higher revenue may not be improving economics |
| One product drives most growth | Product concentration | Overall performance may depend on a small part of the portfolio |
| One channel is falling while total sales rise | Channel-level performance | Growth elsewhere may be hiding weakness |
If you need recurring monitoring, keep it compact. Revenue, orders, units, repeat-customer behavior, product contribution, discounting, channel performance and margin cover many common business-performance questions. Add a measure only when it helps answer a decision.
Do not rush from a pattern to a cause
Suppose prices increased at the same time repeat customers declined.
It is reasonable to investigate whether the two are connected. It is not reasonable to say the price increase caused customers to leave without additional evidence.
A competitor may have entered the market. An important product may have been unavailable. Service quality may have changed. Those customers may have been seasonal. Marketing may have changed.
A good analysis first establishes what changed and where. The explanation comes next, once the available evidence can support it.
A simple way to investigate a change
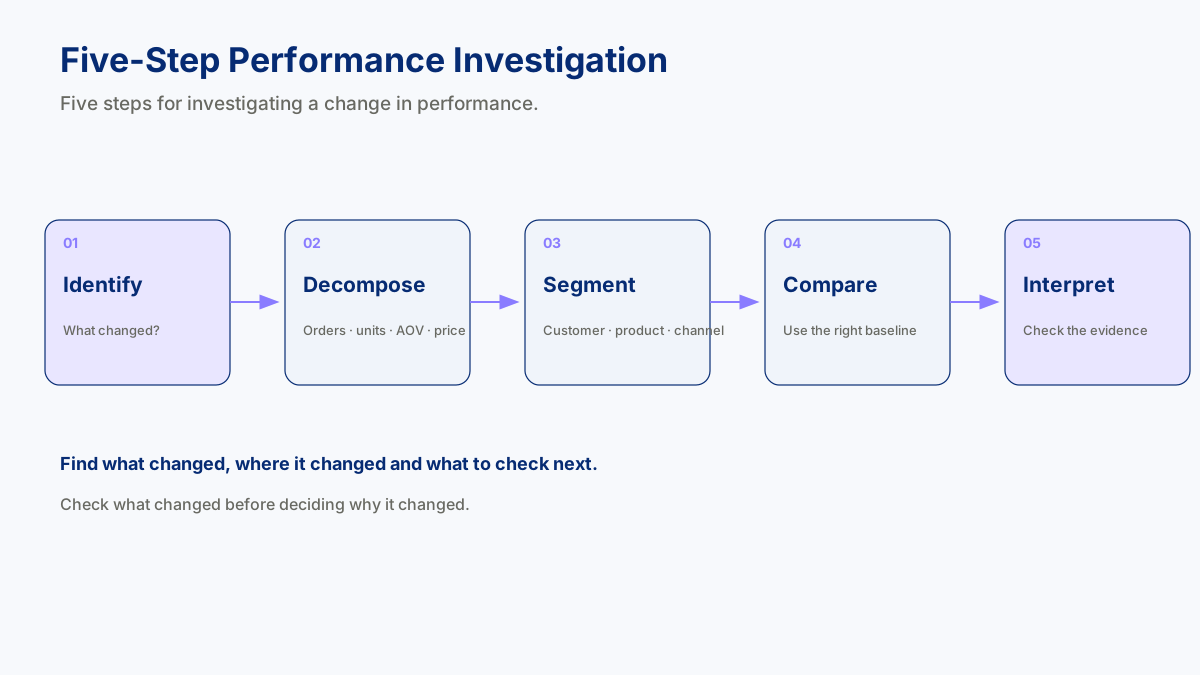
When an important number moves, use this sequence:
Identify → Decompose → Segment → Compare → Interpret
Start with the result. Break it into its parts. Find out where the movement is concentrated. Compare it with an appropriate baseline. Then decide what the evidence actually tells you.
“Sales are down” may become:
“Orders fell, but average order value increased. Most of the decline came from returning customers and one product category, and the decline began before the latest price change.”
That is a much better place from which to make a business decision.
Look beneath the headline
Small businesses are operating in a mix of continued consumer spending, higher prices, cost pressure and customers who are paying close attention to value.
That makes it especially important to understand what your own numbers are actually saying.
If revenue rises, ask what drove it. If revenue falls, find where the decline occurred. Look at orders, units, customers, product mix, discounting, channels and—where reliable cost data exists—margin.
The goal is not to track every possible metric. It is to understand what changed, where it changed and what deserves your attention next.
Because sometimes the most important thing your data can tell you is that the headline number is not the whole story.